Introduction to SEAS
Understanding your sample subsets: an introduction to SEAS
Have you ever examined a specific group of samples, such as patients with a particular treatment response or cells exhibiting unique behaviors, and wondered what clinical or experimental details make them distinct? Identifying which characteristics are truly enriched or over-represented in that subset compared to the entire dataset can be surprisingly complex. This challenge is common when working with high-dimensional biomedical data.
That’s where SEAS (Statistical Enrichment Analysis of Samples) comes into play. SEAS is an interactive online tool designed for this purpose: to help you explore the clinical attributes (or “clinotypes,” such as age group, treatment status, or survival days) within your sample cohort and identify which ones are significantly over-represented compared to your overall dataset. It is useful whether you’re balancing case-control groups for a study or just trying to understand a specific sample subset better. Existing tools often struggled to integrate different data types or to identify similar samples automatically.
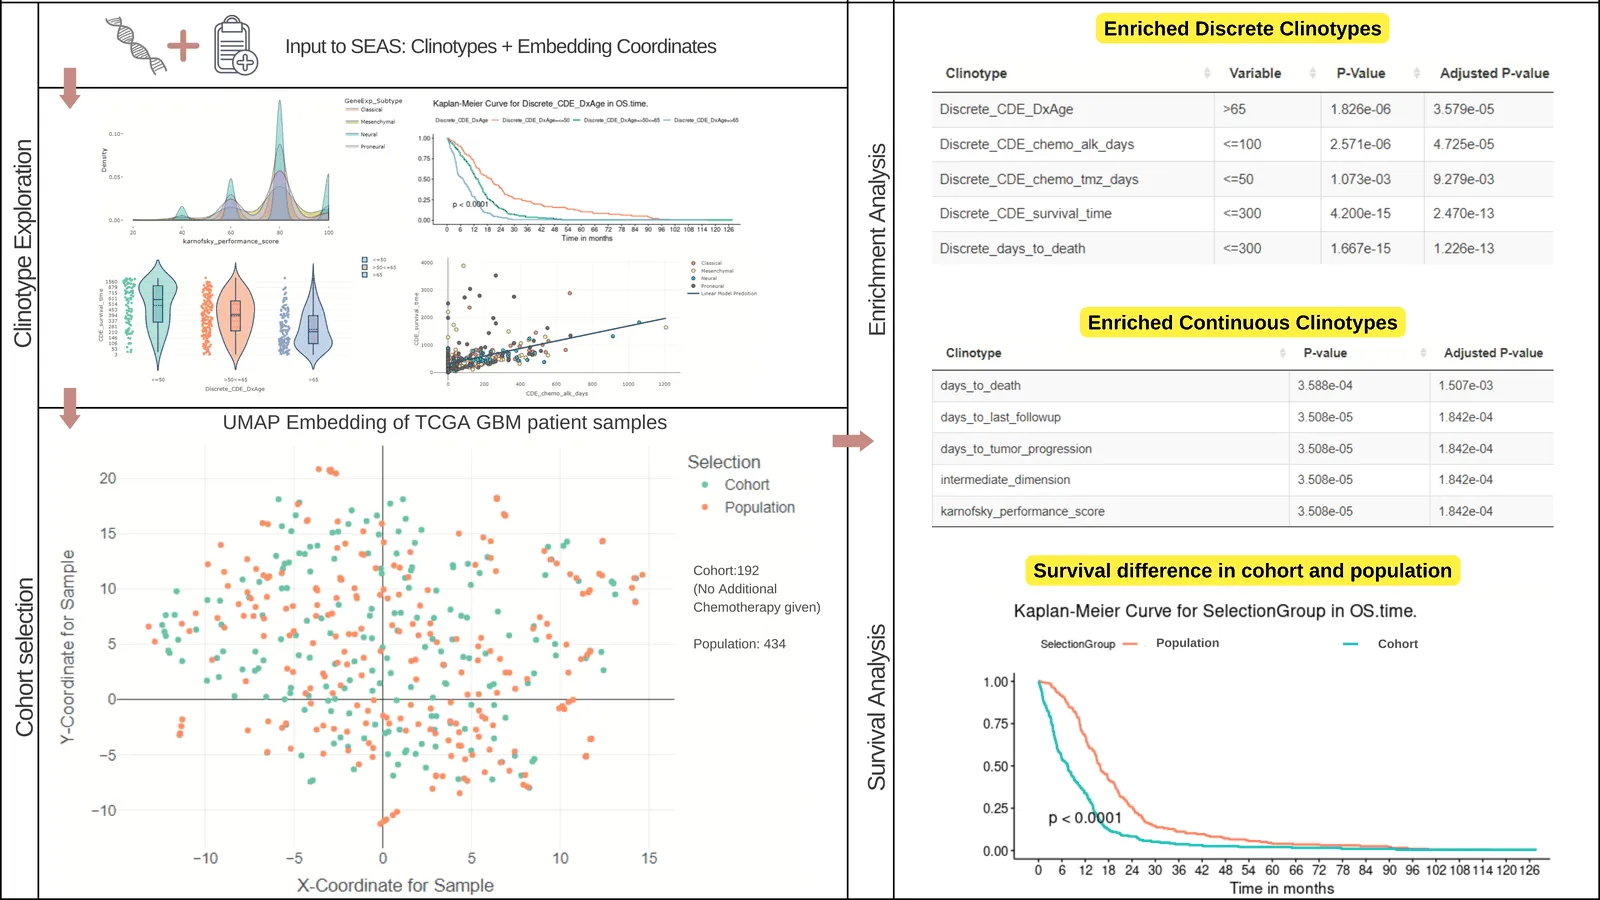
What SEAS Does
#-
Identifies statistically enriched clinical features (clinotypes) in a user-defined sample subset.
-
Works with both categorical (e.g., gender, treatment type) and numerical data (e.g., age, survival time).
-
Provides visualizations to explore clinical features (like density plots, survival plots) and sample relationships (embedding plots).
-
Can help quantify and visualize similarities between patients or samples.
-
Supports automatic clustering to help identify meaningful subcohorts.
My Role
#I developed SEAS as my undergraduate thesis project. My work involved building the tool itself and implementing various interactive components, including visualizations for exploring clinical data distribution, survival analysis, and sample embeddings, along with methods for interactive cohort selection.
How You Can Use It
#-
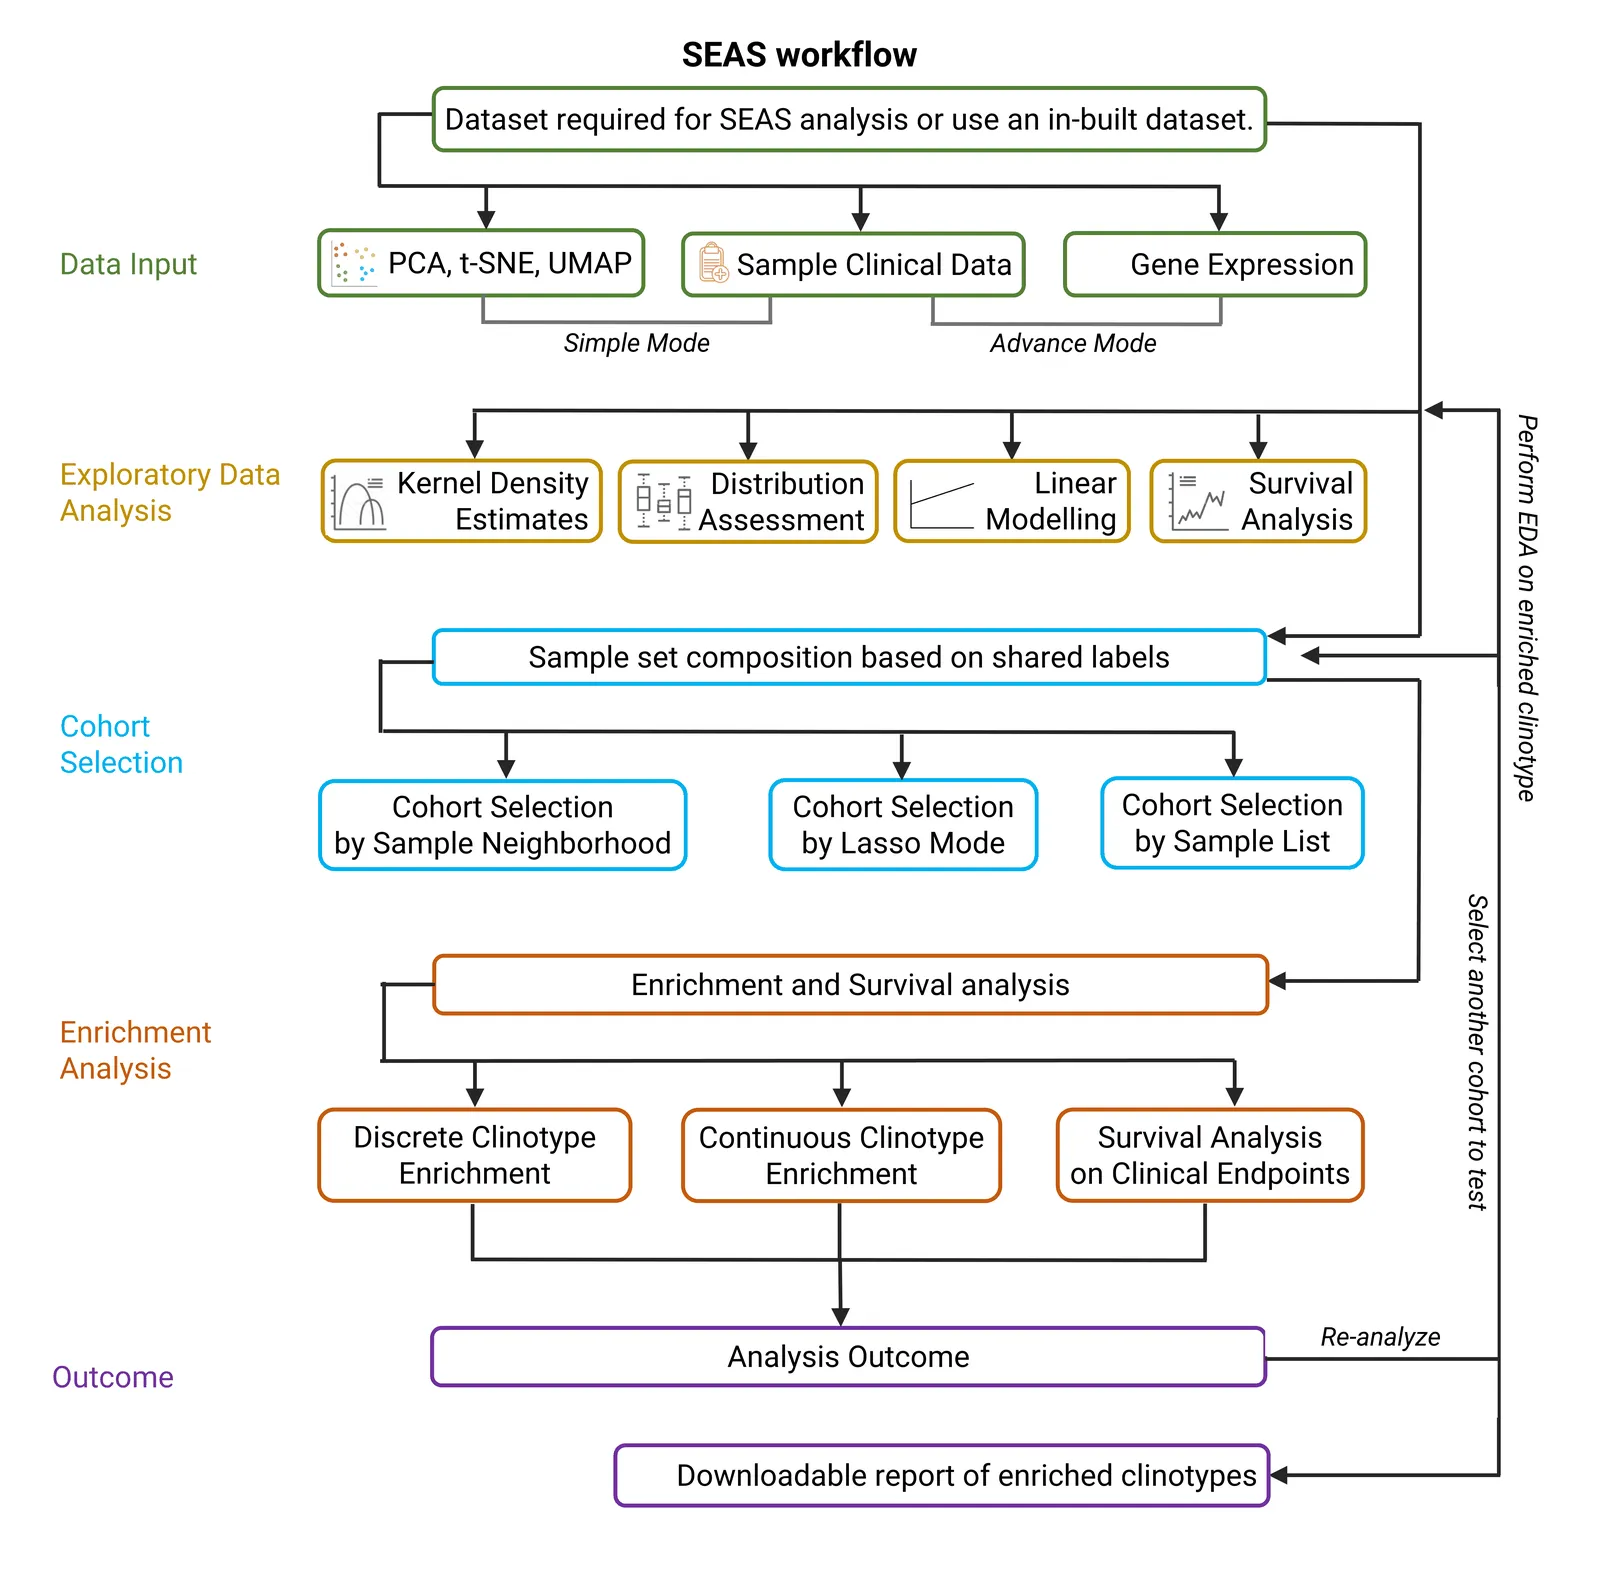
Upload your clinical metadata table.
-
Upload your sample embedding (generated from gene expression or similar matrices).
-
Explore relationships among sample clinotypes (features).
-
Define your sample subset of interest (you can select manually, or SEAS can help identify clusters).
-
SEAS performs Clinical Feature Enrichment Analysis (CFEA) and reports the features significantly enriched in your subset, complete with statistical measures.
Check it Out
#-
Try the live SEAS tool here: https://aimed-lab.shinyapps.io/SEAS/
-
Find more info and documentation here: https://aimed-lab.github.io/SEAS/
References
#Nguyen, T. M., Bharti, S., Yue, Z., Willey, C. D., & Chen, J. Y. (2021). Statistical Enrichment Analysis of Samples: A General-Purpose Tool to Annotate Metadata Neighborhoods of Biological Samples. Frontiers in big data, 4, 725276. https://doi.org/10.3389/fdata.2021.725276
Nguyen, T. M., Bharti, S., Yue, Z., Willey, C. D., & Chen, J. Y. (2021). Corrigendum: Statistical Enrichment Analysis of Samples: A General-Purpose Tool to Annotate Metadata Neighborhoods of Biological Samples. Frontiers in big data, 4, 804141. https://doi.org/10.3389/fdata.2021.804141