Example: volcano plot
A small analysis app with hosted inputs, value boxes and a Shiny module, with a Python server and a React client.
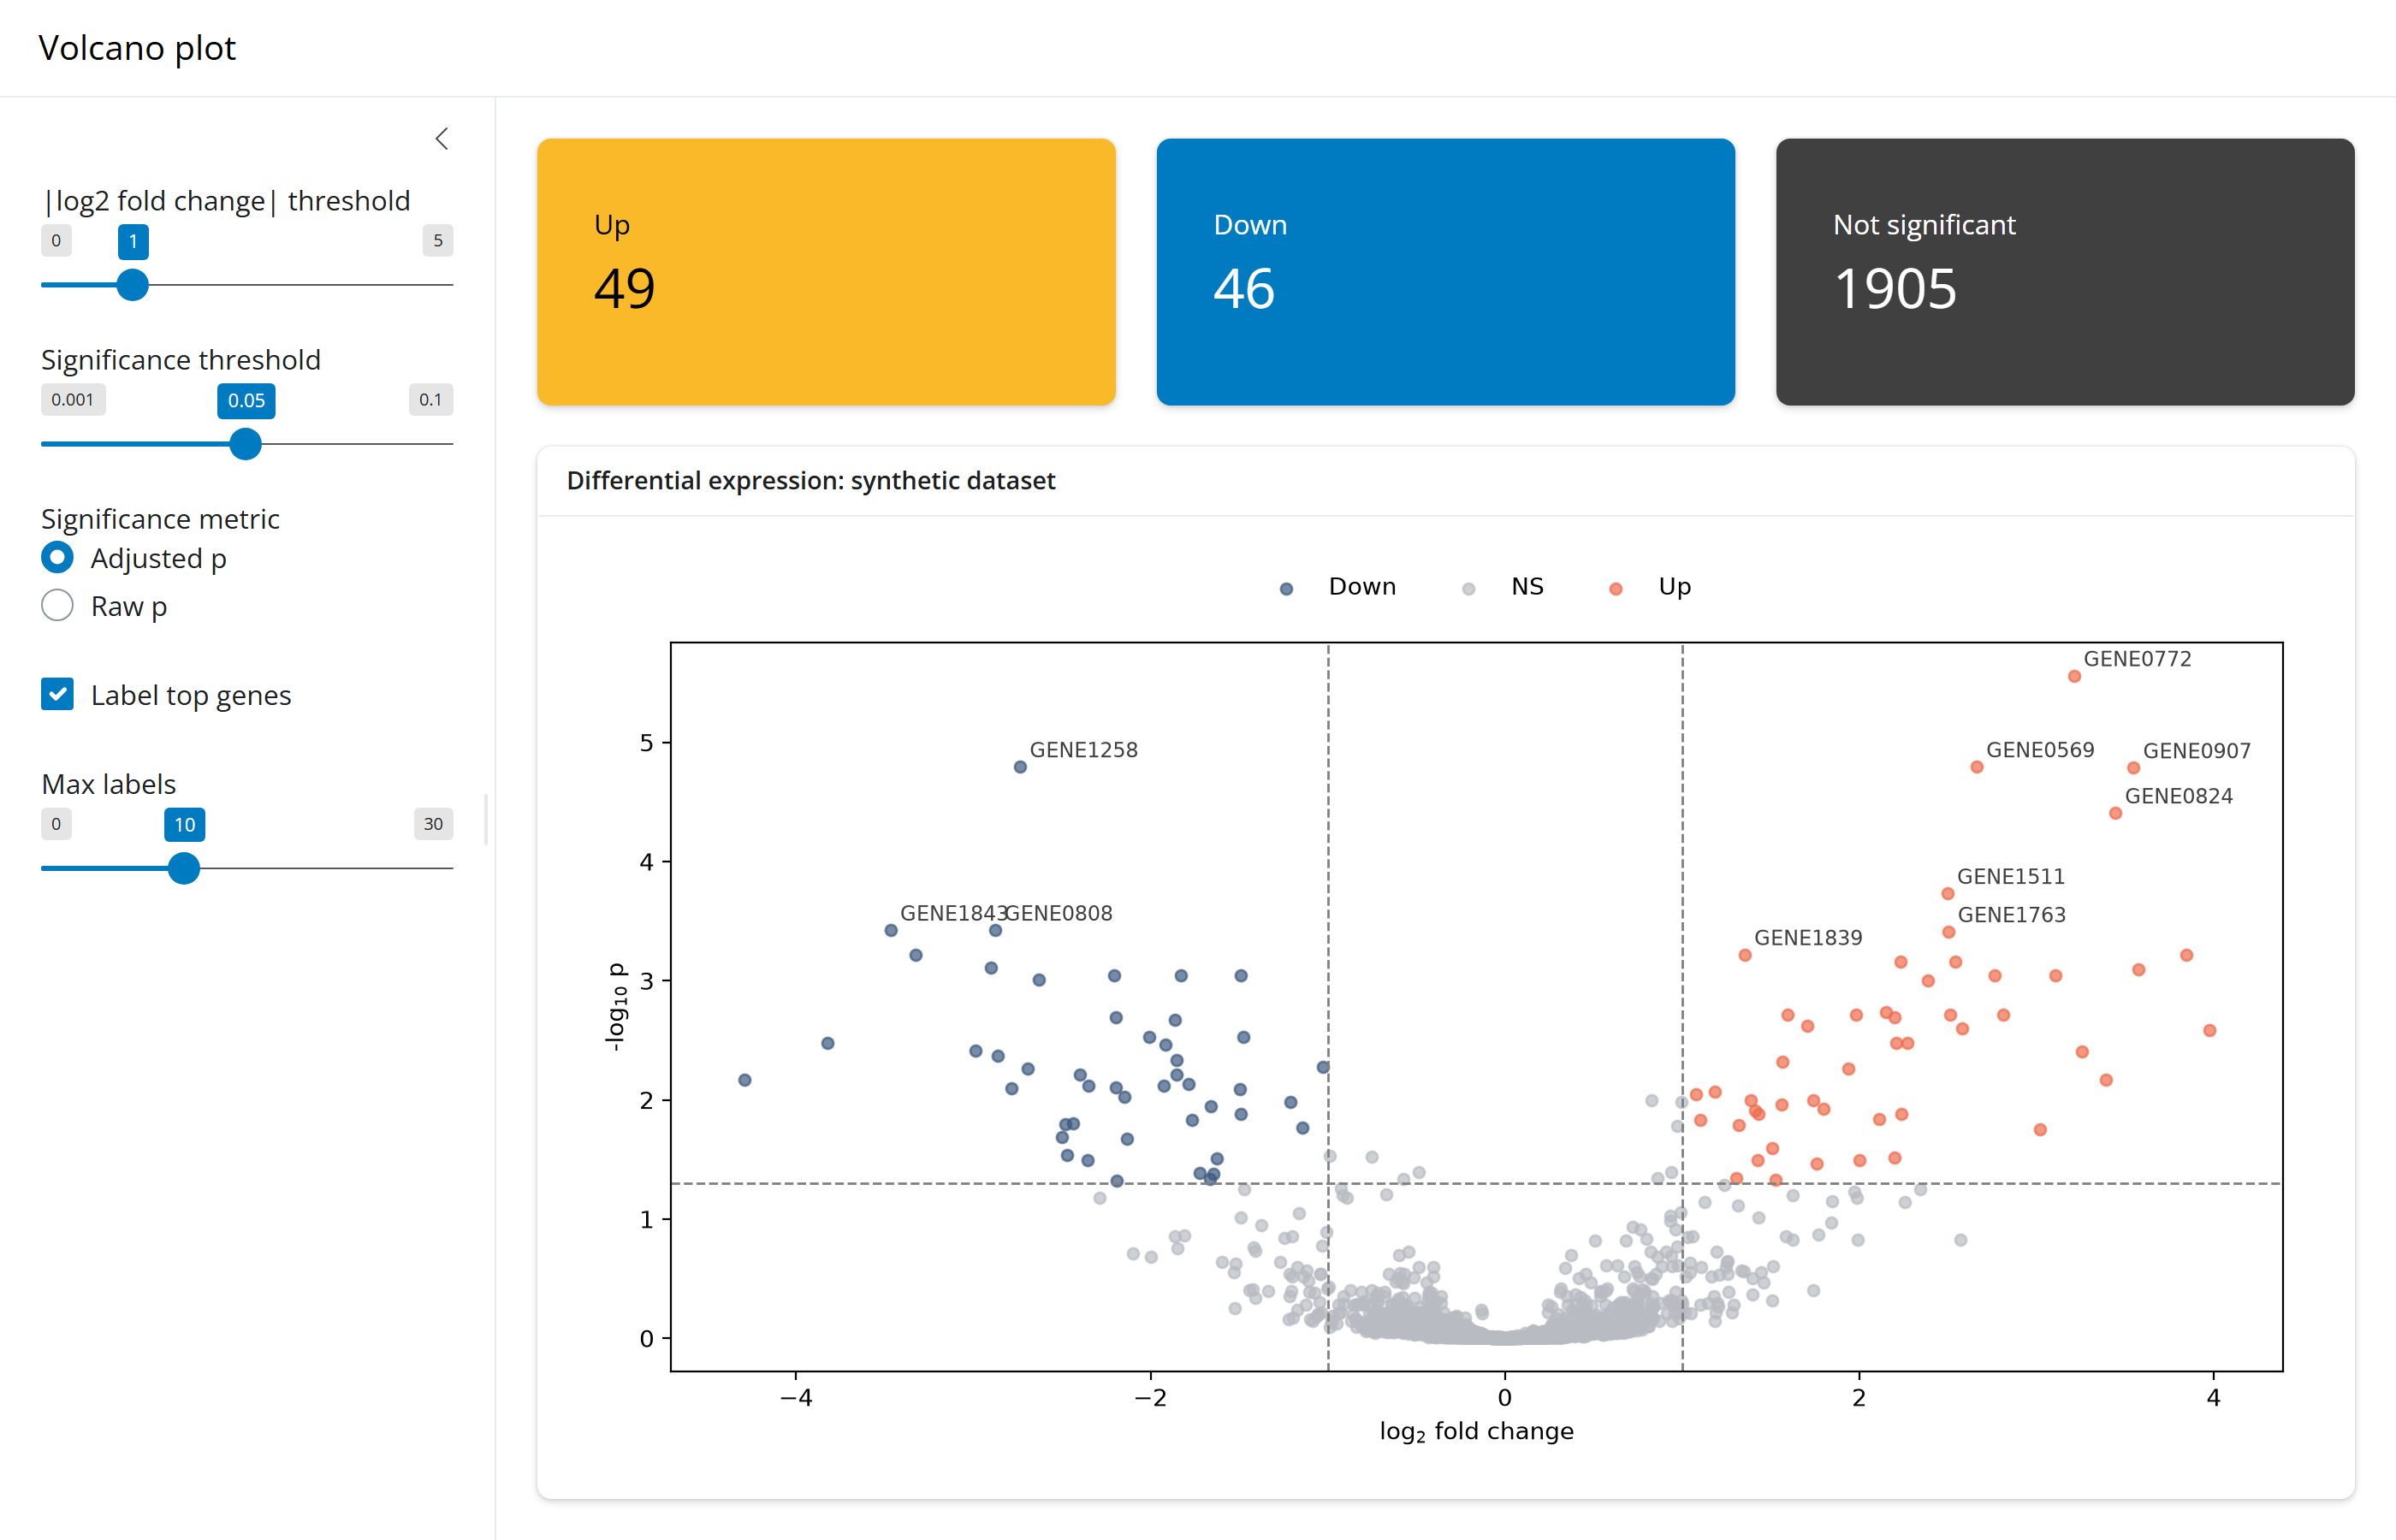
examples/volcano-plot is a small analysis app with the usual bslib shape: controls in a sidebar, a row of value boxes, and a plot in a card. It was ported from a plain bslib app, and the server kept its shape. Only the layout moved to React.
Run it
The built client is committed, so the app runs without Node:
git clone https://github.com/samuelbharti/bslibreact.git
pip install bslibreact shinyreact pandas matplotlib brand_yml
shiny run bslibreact/examples/volcano-plot/app.py
brand_yml is needed because the app reads its theme from the _brand.yml file in the folder.
The page
src/App.tsx lays out the whole page. Each component stands for one call: PageSidebar for ui.page_sidebar(), LayoutColumns for ui.layout_columns(), ValueBox for ui.value_box(), Card for ui.card().
<PageSidebar title="Volcano plot" sidebarWidth={290} sidebar={<Sidebar />}>
  <LayoutColumns colWidths={[4, 4, 4]} fill={false}>
    <ValueBox title="Up" theme="warning">
      <TextOutput id="n_up" className="value-box-value" />
    </ValueBox>
    <ValueBox title="Down" theme="primary">
      <TextOutput id="n_down" className="value-box-value" />
    </ValueBox>
    <ValueBox title="Not significant" theme="secondary">
      <TextOutput id="n_ns" className="value-box-value" />
    </ValueBox>
  </LayoutColumns>
  <Card fullScreen>
    <CardHeader>Differential expression: synthetic dataset</CardHeader>
    <CardBody>
      <Module namespace="volcano">
        <PlotOutput id="plot" height="560px" click="click" />
      </Module>
    </CardBody>
  </Card>
</PageSidebar>
Five hosted inputs
The sidebar holds two threshold sliders, a radio group, a checkbox and a label count slider. The server renders each one with host_input(), so they are Shiny’s own widgets:
host_input(
    output,
    "lfc",
    lambda: ui.input_slider("lfc", "|log2 fold change| threshold", 0, 5, 1, step=0.1),
)
host_input(
    output,
    "pcol",
    lambda: ui.input_radio_buttons(
        "pcol", "Significance metric", {"padj": "Adjusted p", "pvalue": "Raw p"}
    ),
)
host_input(
    output, "dolabel", lambda: ui.input_checkbox("dolabel", "Label top genes", True)
)
The client mounts each one by its id plus _ui, with the component that matches the widget:
function Sidebar() {
  return (
    <>
      <SliderInput id="lfc_ui" />
      <SliderInput id="p_ui" />
      <RadioButtons id="pcol_ui" />
      <CheckboxInput id="dolabel_ui" />
      <SliderInput id="topn_ui" />
    </>
  );
}
Waiting for the inputs
A hosted input has no value until the client has mounted it. Reading it before then stops the calculation silently, so the plot and the counts stay blank until every input has arrived. The server needs no extra code for this:
vdata = volcano_server(
    "volcano",
    lfc_threshold=lambda: input.lfc(),
    p_threshold=lambda: input.p(),
    p_col=lambda: input.pcol(),
    label_top_n=lambda: input.topn() if input.dolabel() else 0,
)
A plot inside a Shiny module
The plot is rendered by a real module, declared with @module.server and called as volcano_server("volcano", ...), so its output id on the page is volcano-plot. On the client, <Module namespace="volcano"> adds the same prefix to every id inside it, so <PlotOutput id="plot" /> displays volcano-plot.
The click prop on the plot serves the R server, which maps a click to the nearest gene. The Python server does not read it.
Value boxes that read text
The three counts are plain @render.text outputs:
@reactive.calc
def counts():
    return volcano_status_counts(vdata())

@render.text
def n_up():
    return str(counts()["Up"])
Each one shows through a <TextOutput> inside a <ValueBox>. The value box itself is React markup and needs nothing from the server.
More
- Get started builds a smaller app step by step.
- The R docs have a component gallery that shows each component next to the bslib original.
- The example’s folder has the full source, including the R server.