Genomes, Prompts, and Shiny
Rethinking How We Explore Biological Data
Biologists have a data problem. I build the tools.
You all know Shiny. So today is about what I point it at.
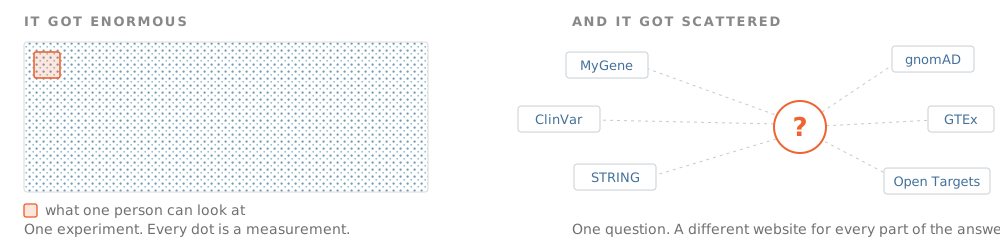
Their tools didn’t keep up. That gap is the job.
The ten apps I built this summer
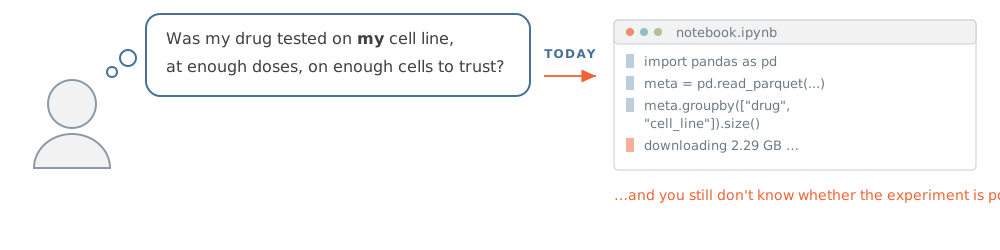
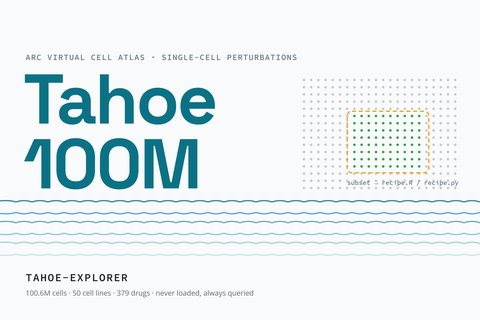 tahoe-explorerPlan a reanalysis before spending compute.
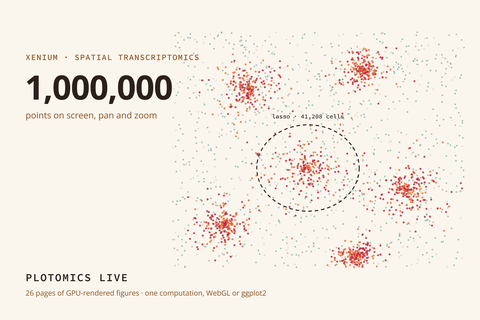 plotomics-liveTwenty-six figures, two engines.
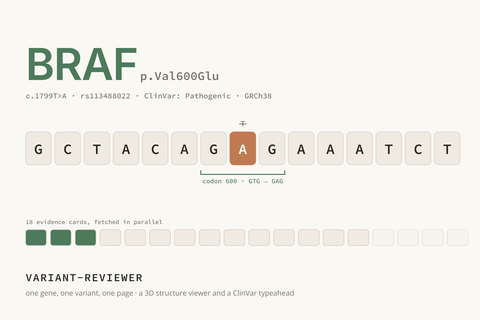 variant-reviewerOne variant, without eighteen tabs.
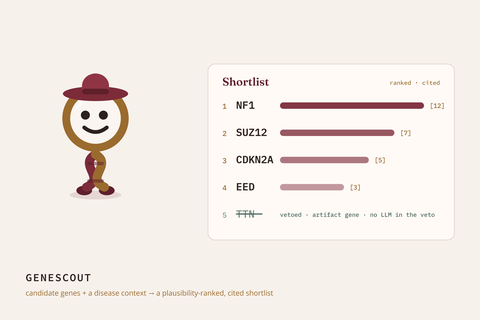 genescout200 candidates to a ranked thirty.
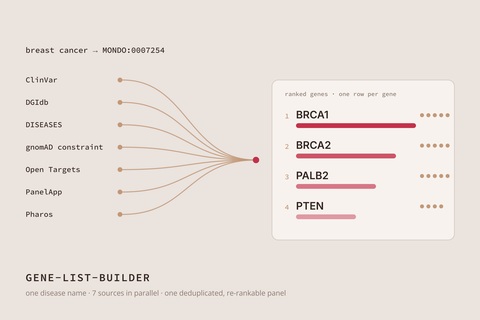 gene-list-builderA disease panel from seven sources.
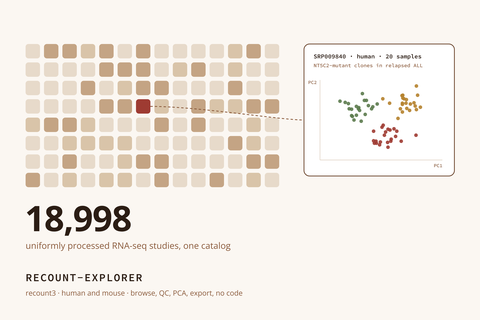 recount-explorerrecount3, without writing any code.
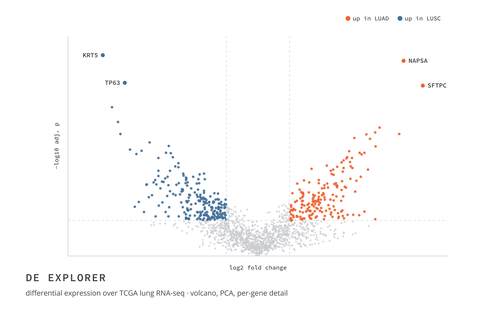 de-explorerWhich genes changed, and by how much.
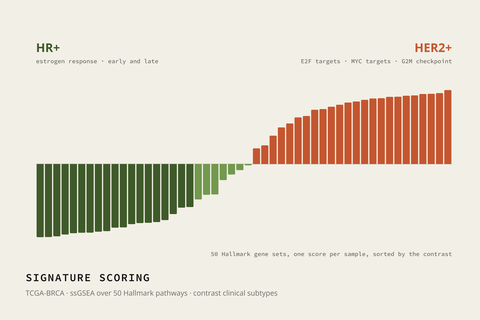 signature-scoringWhich pathways are active where.
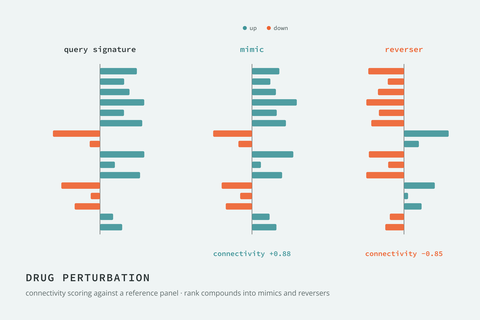 drug-perturbationDrugs that reverse a disease signature.
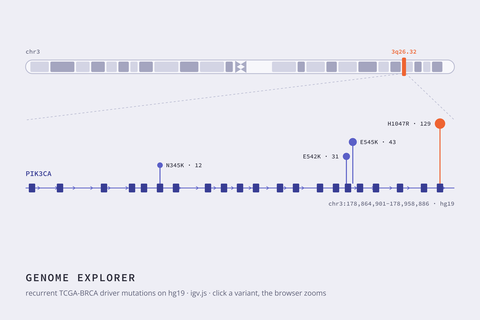 genome-explorerMutations in genomic context.
And five packages underneath them
Each came out of a problem the apps kept hitting. Solve it in the package, and nothing above it has to.
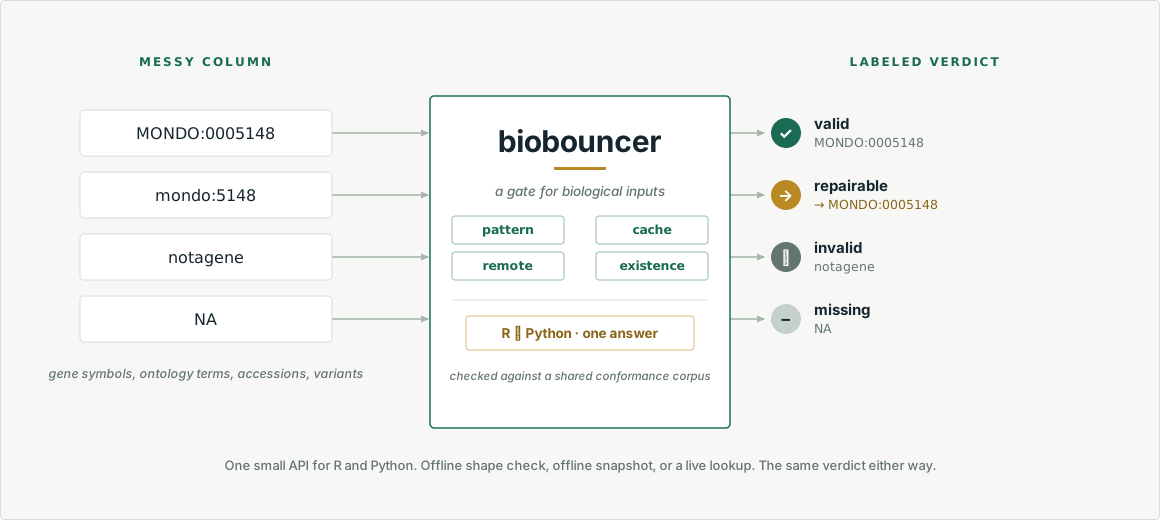
 biobouncerwhether an identifier means anything
 biohttphow we talk to a service
 bioclientswhat each biological service returns
 plotomicsone rendering core, three languages
 biocohorthow a study stays organised
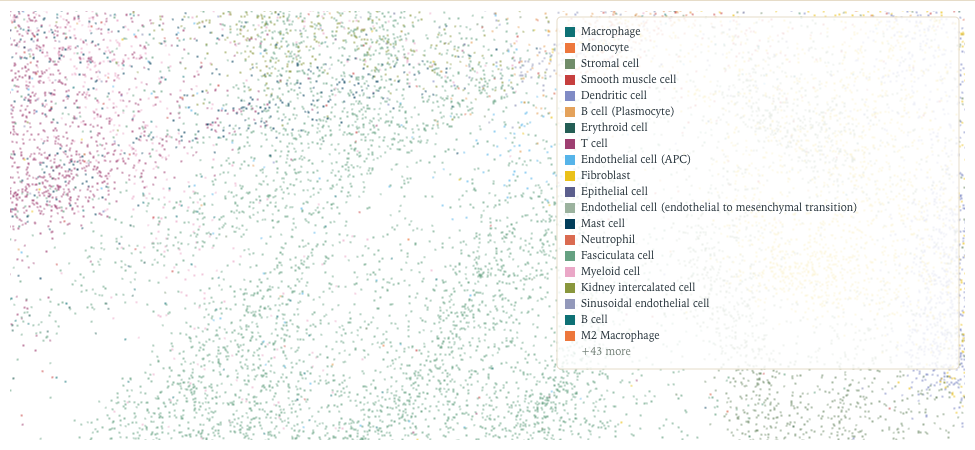
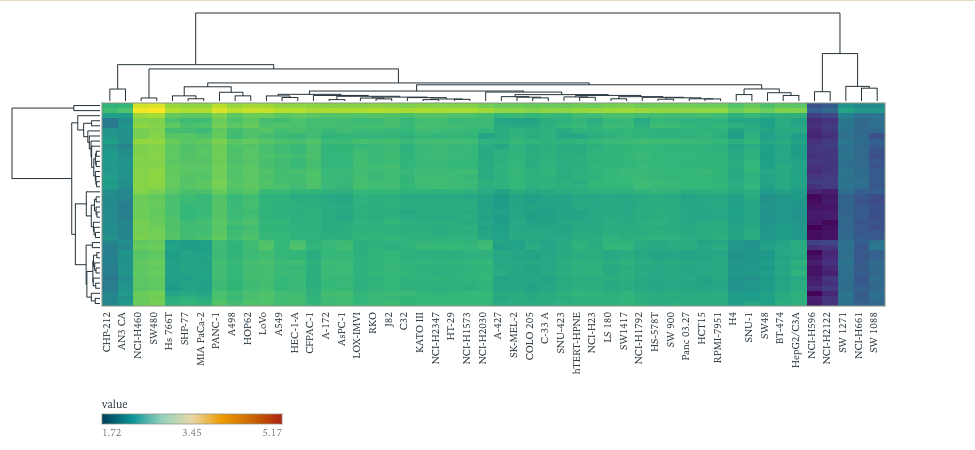
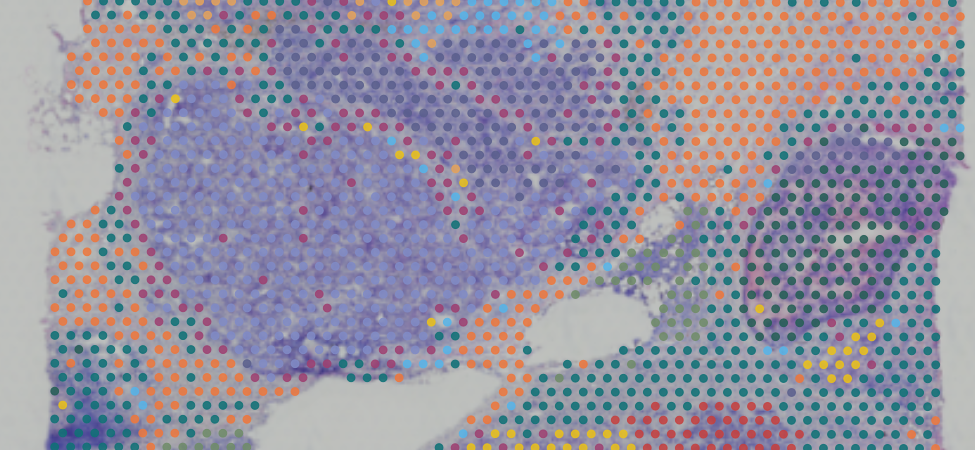
Twenty-six bespoke figures
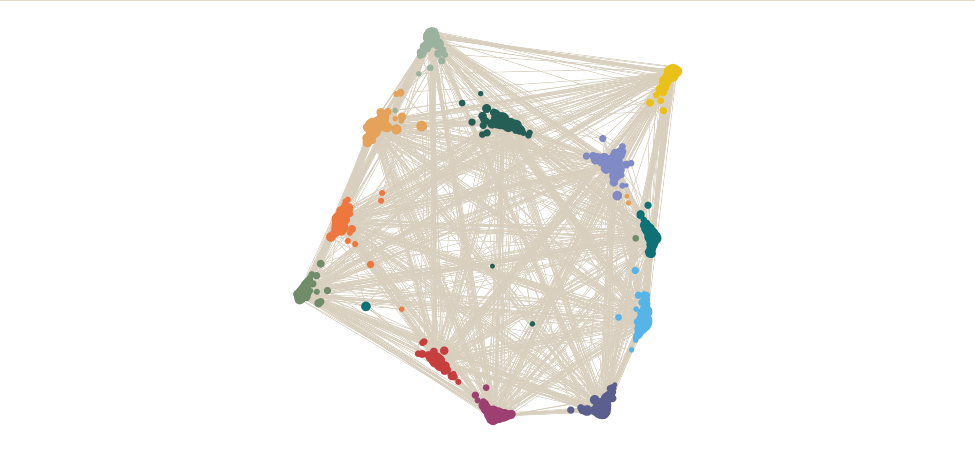
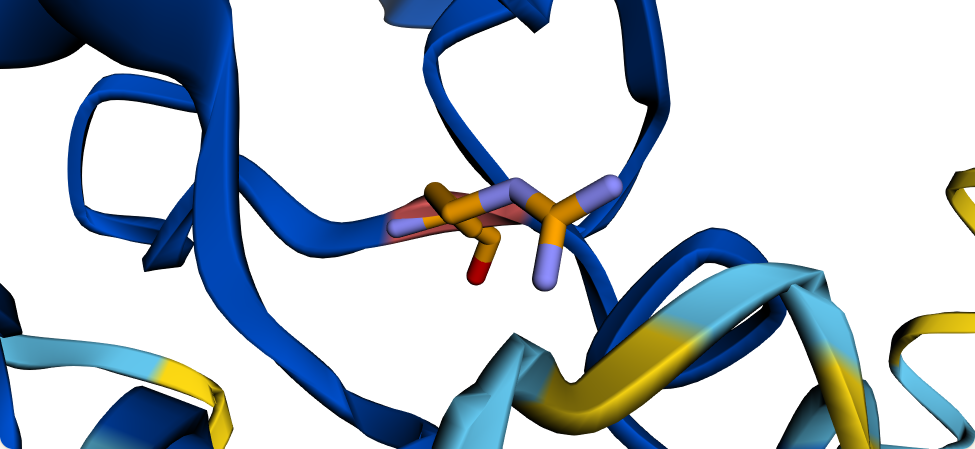
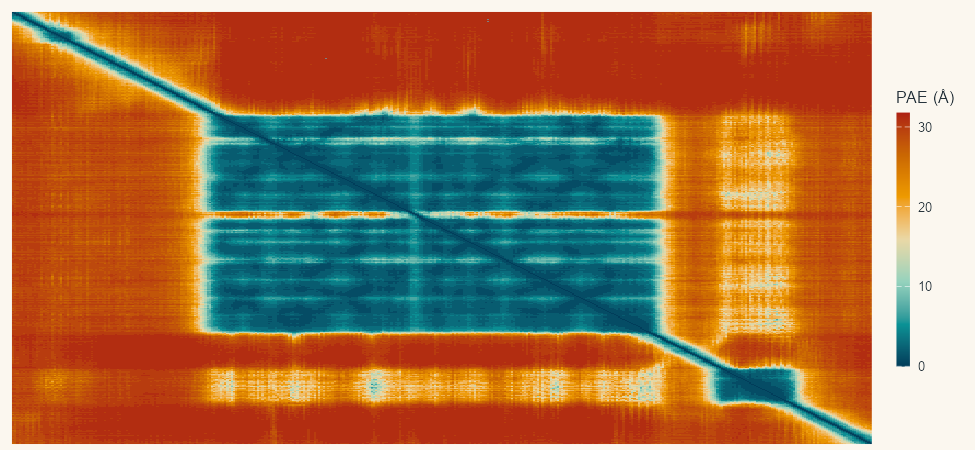
Plotomics Live. Every one of these is a component you can call today, from R, Python or React.
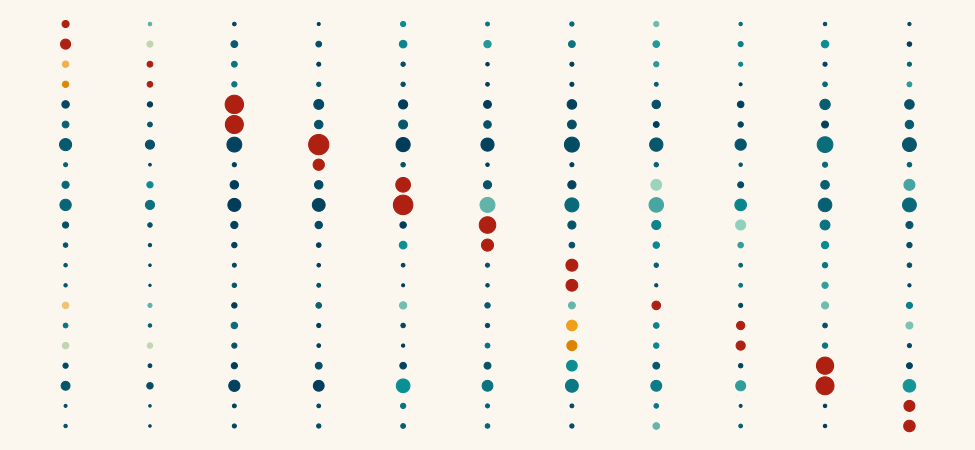
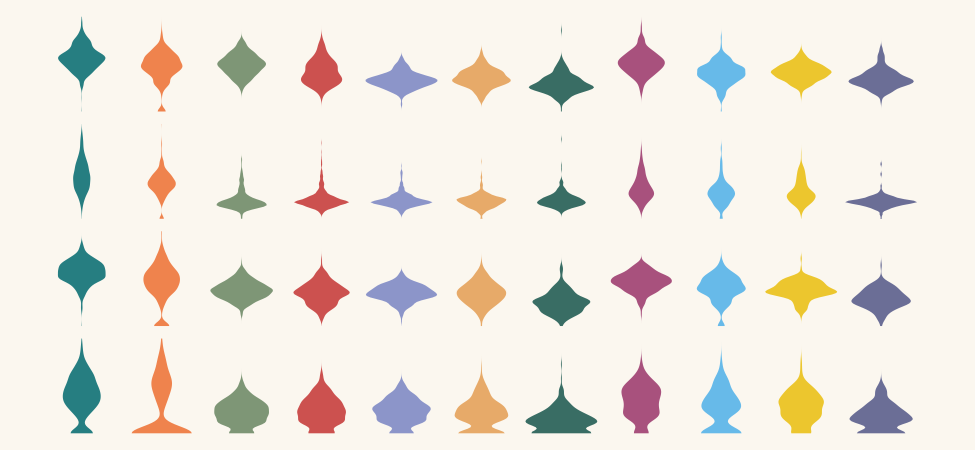
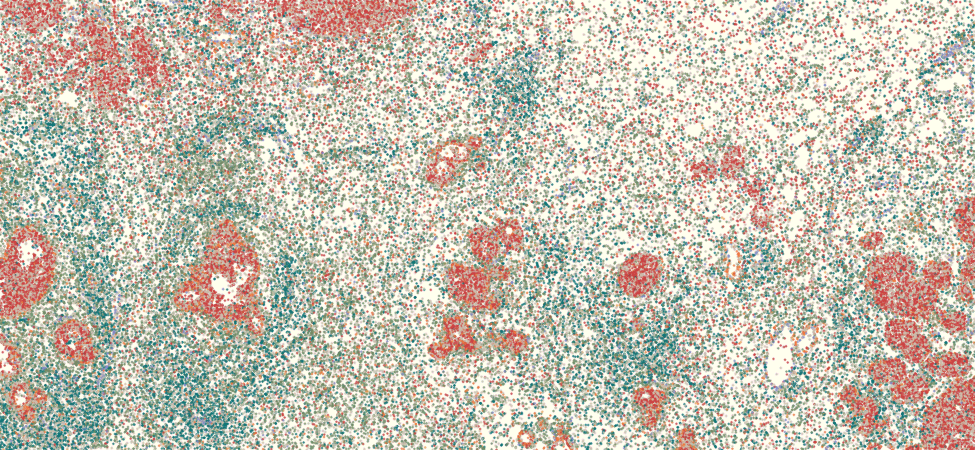
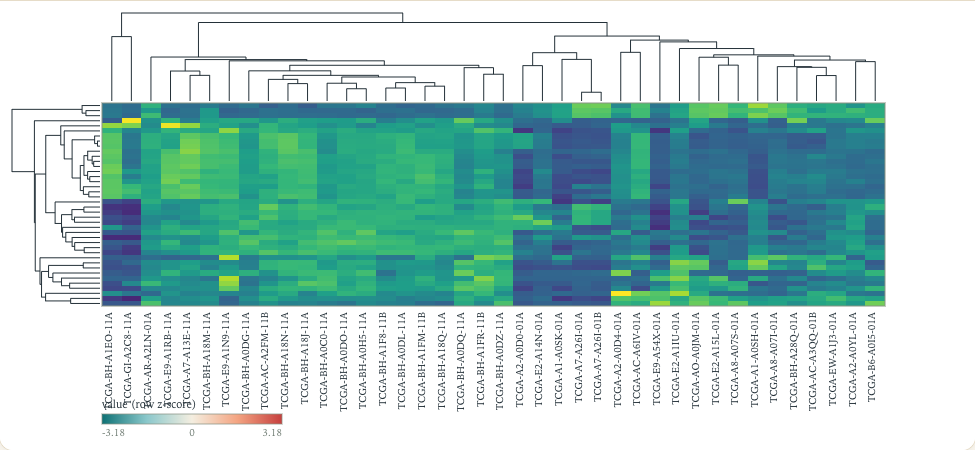
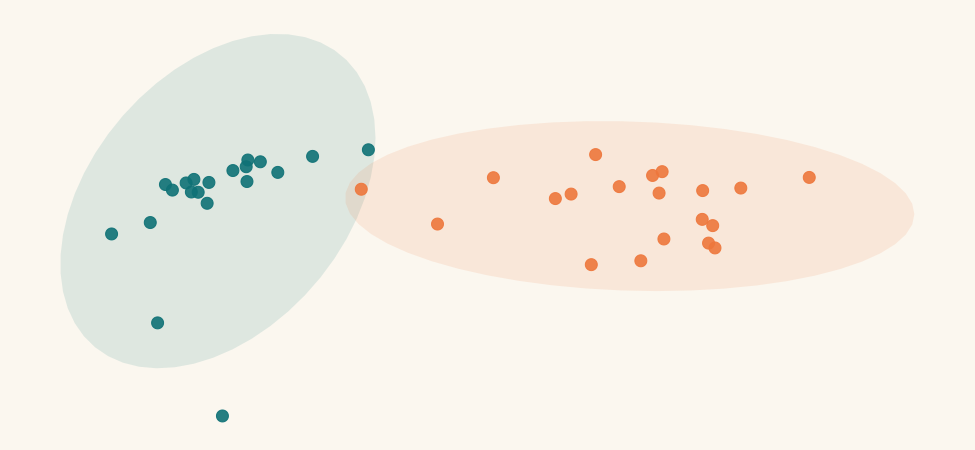
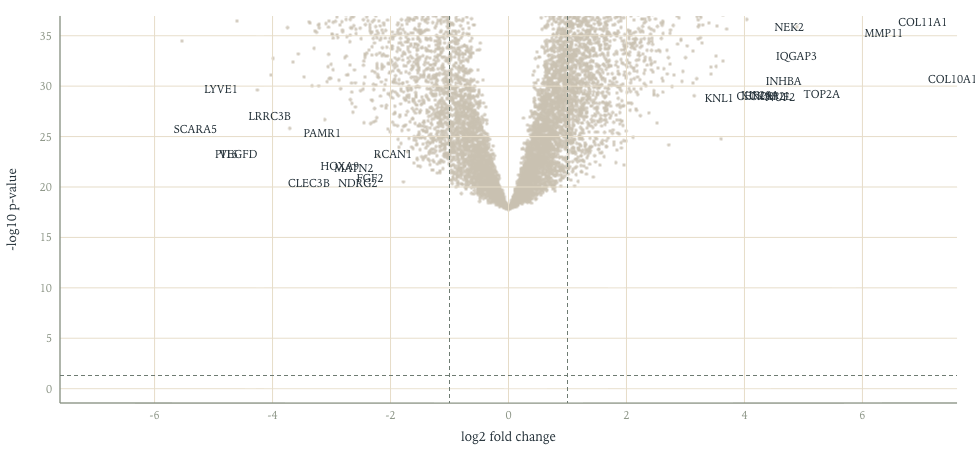
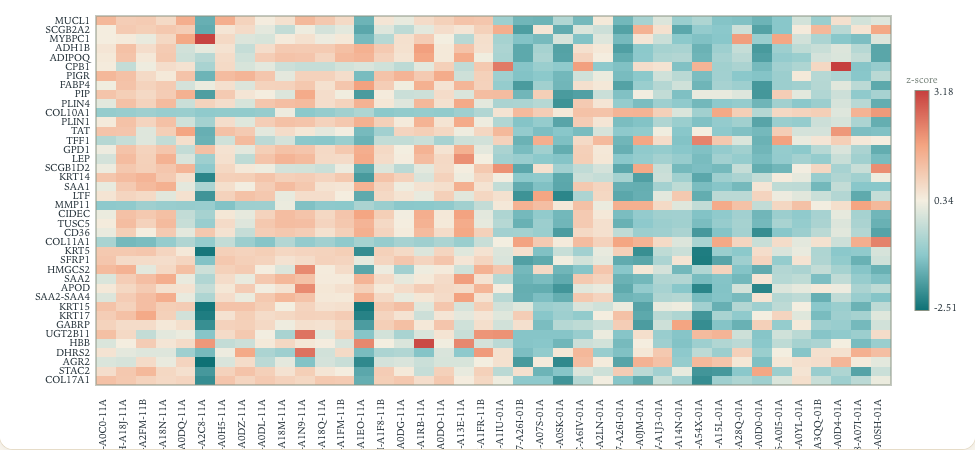
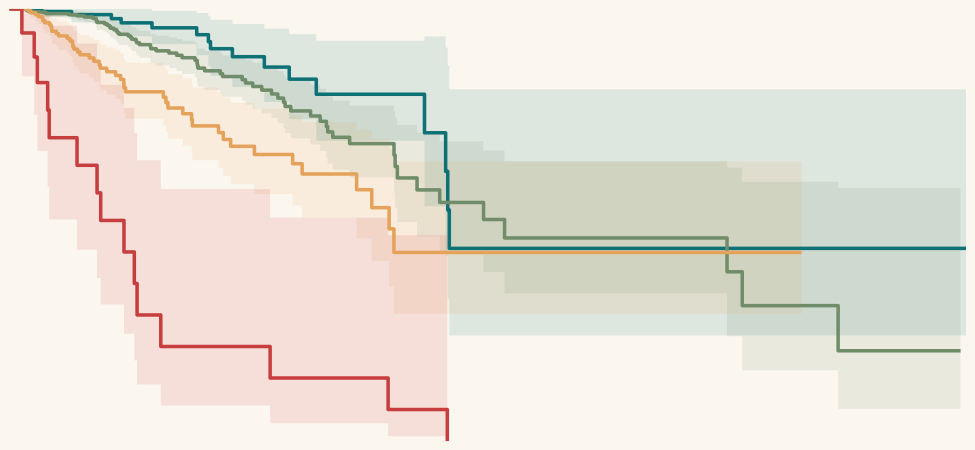
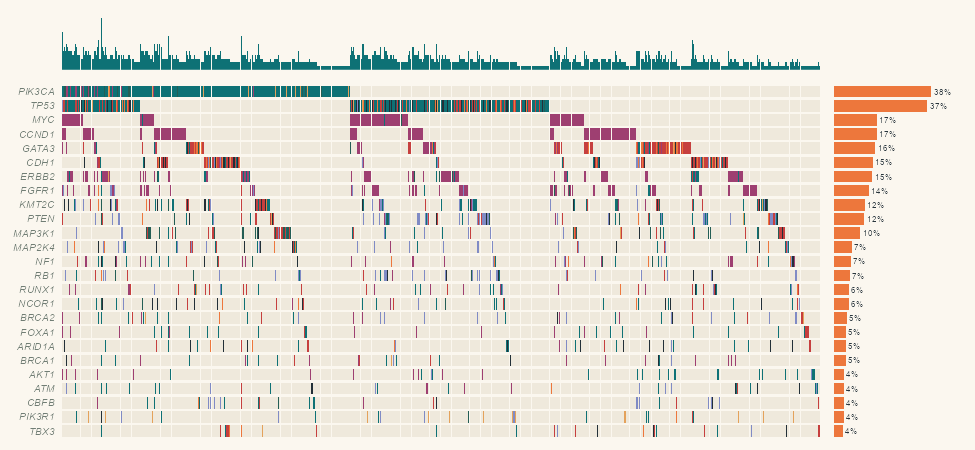
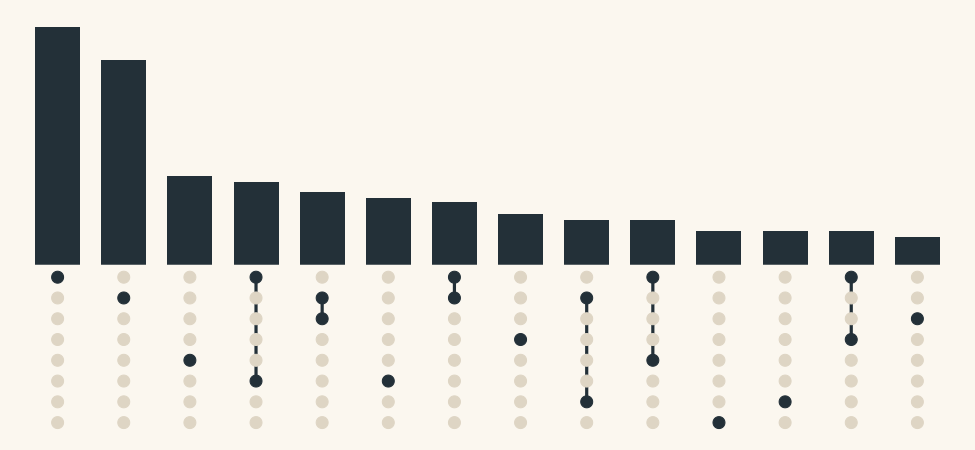
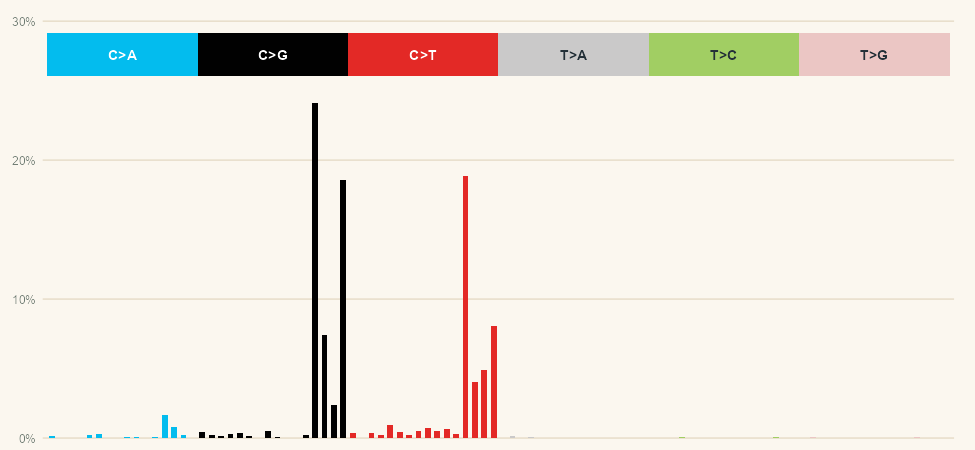
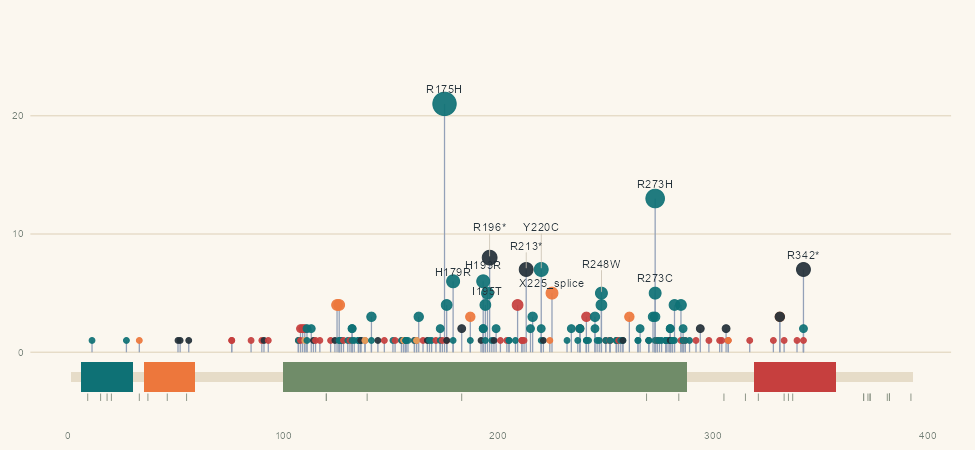
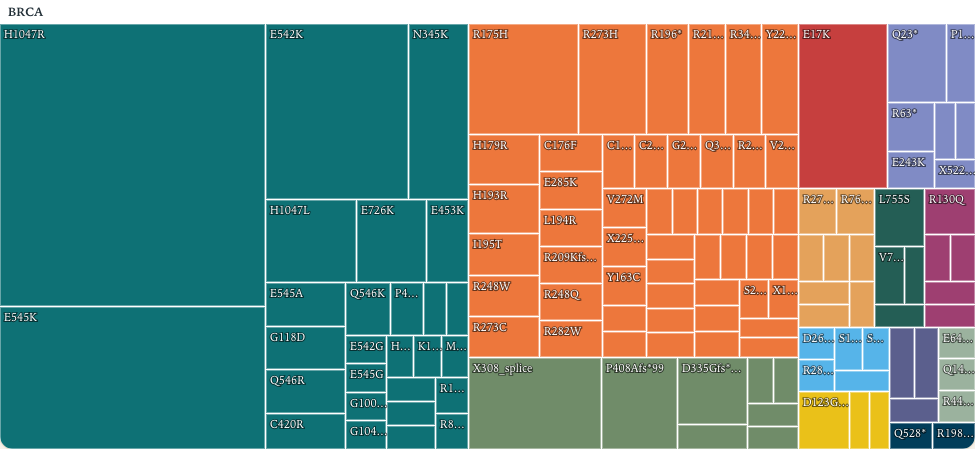
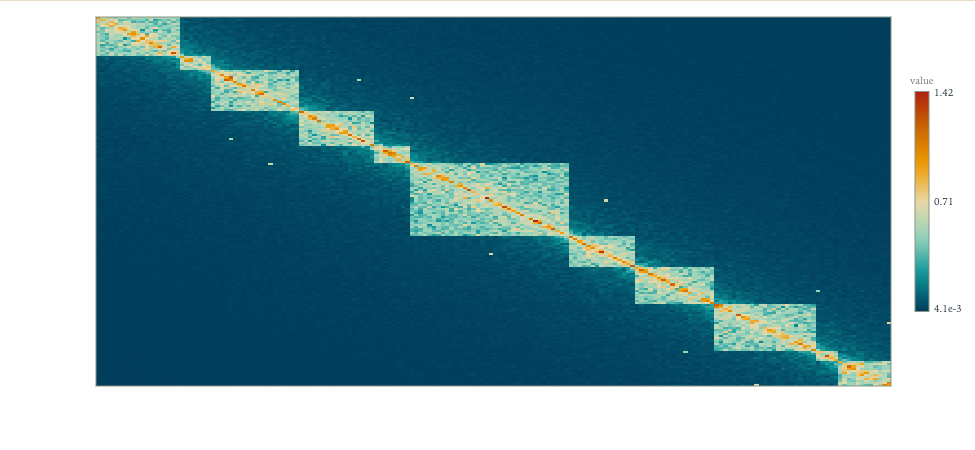
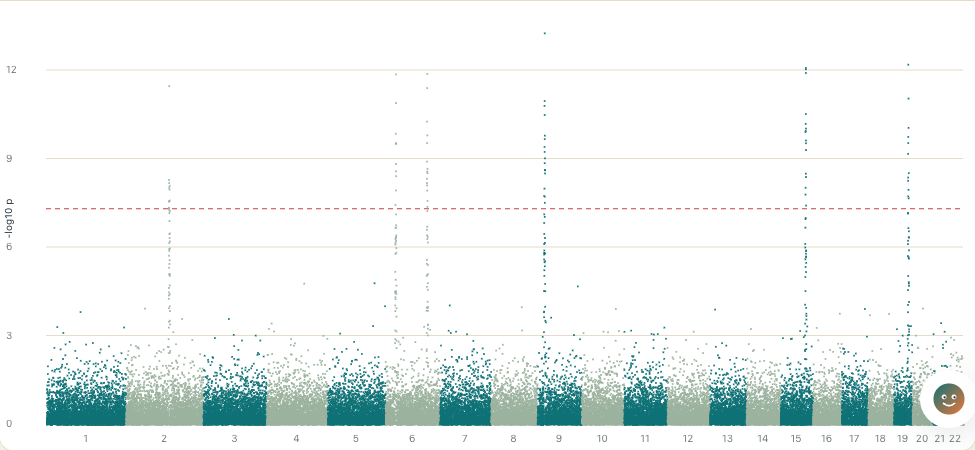
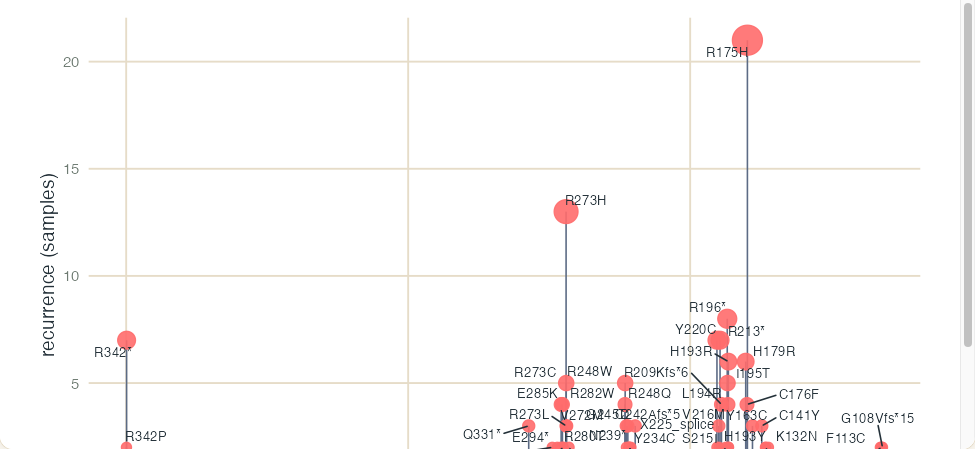
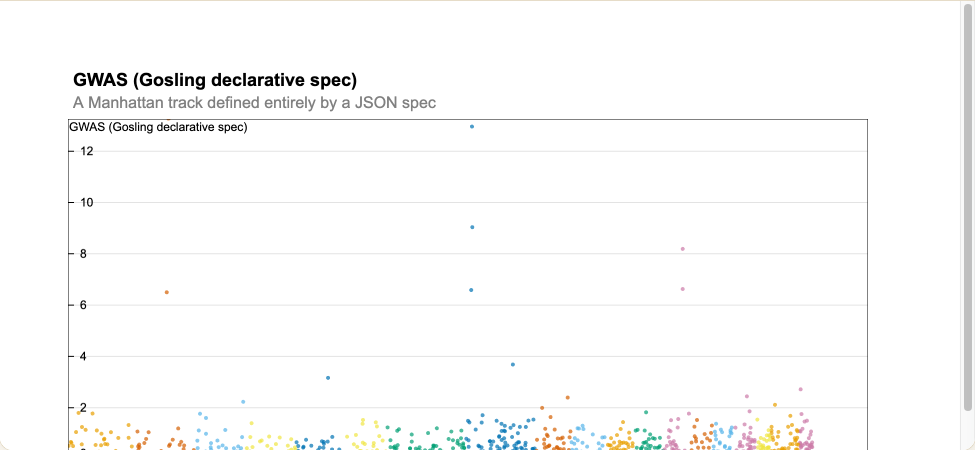
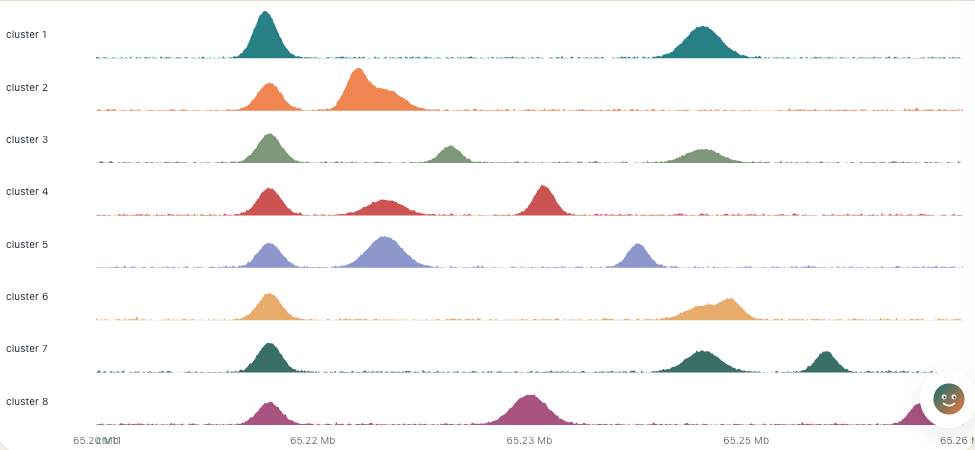
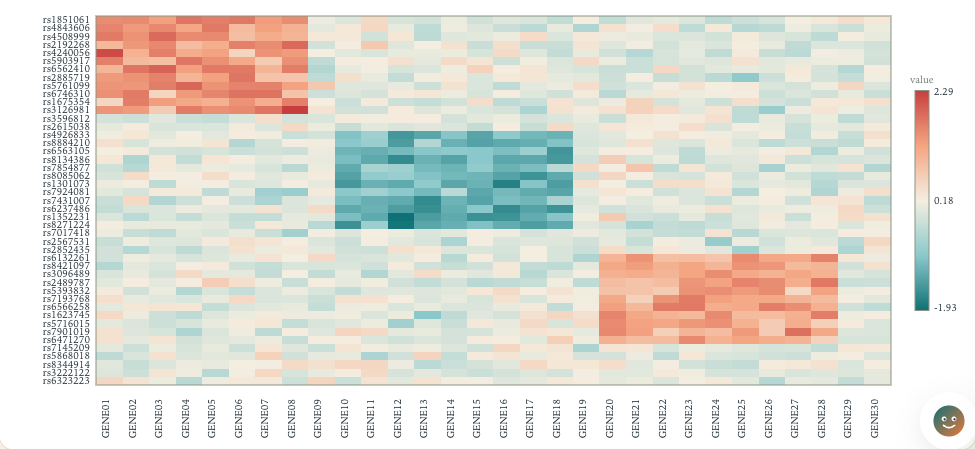
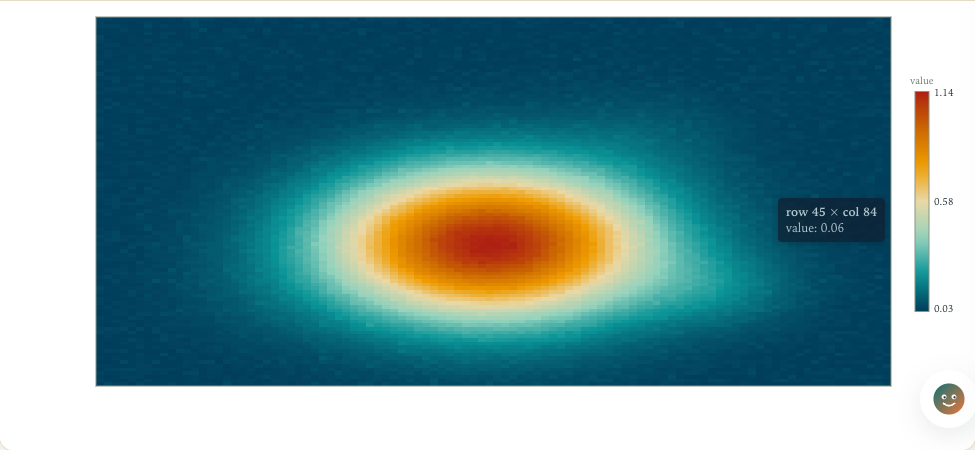
The same page, two engines
Plotomics Live One toggle swaps the GPU React component for the ggplot2 image, over the same server-side computation.
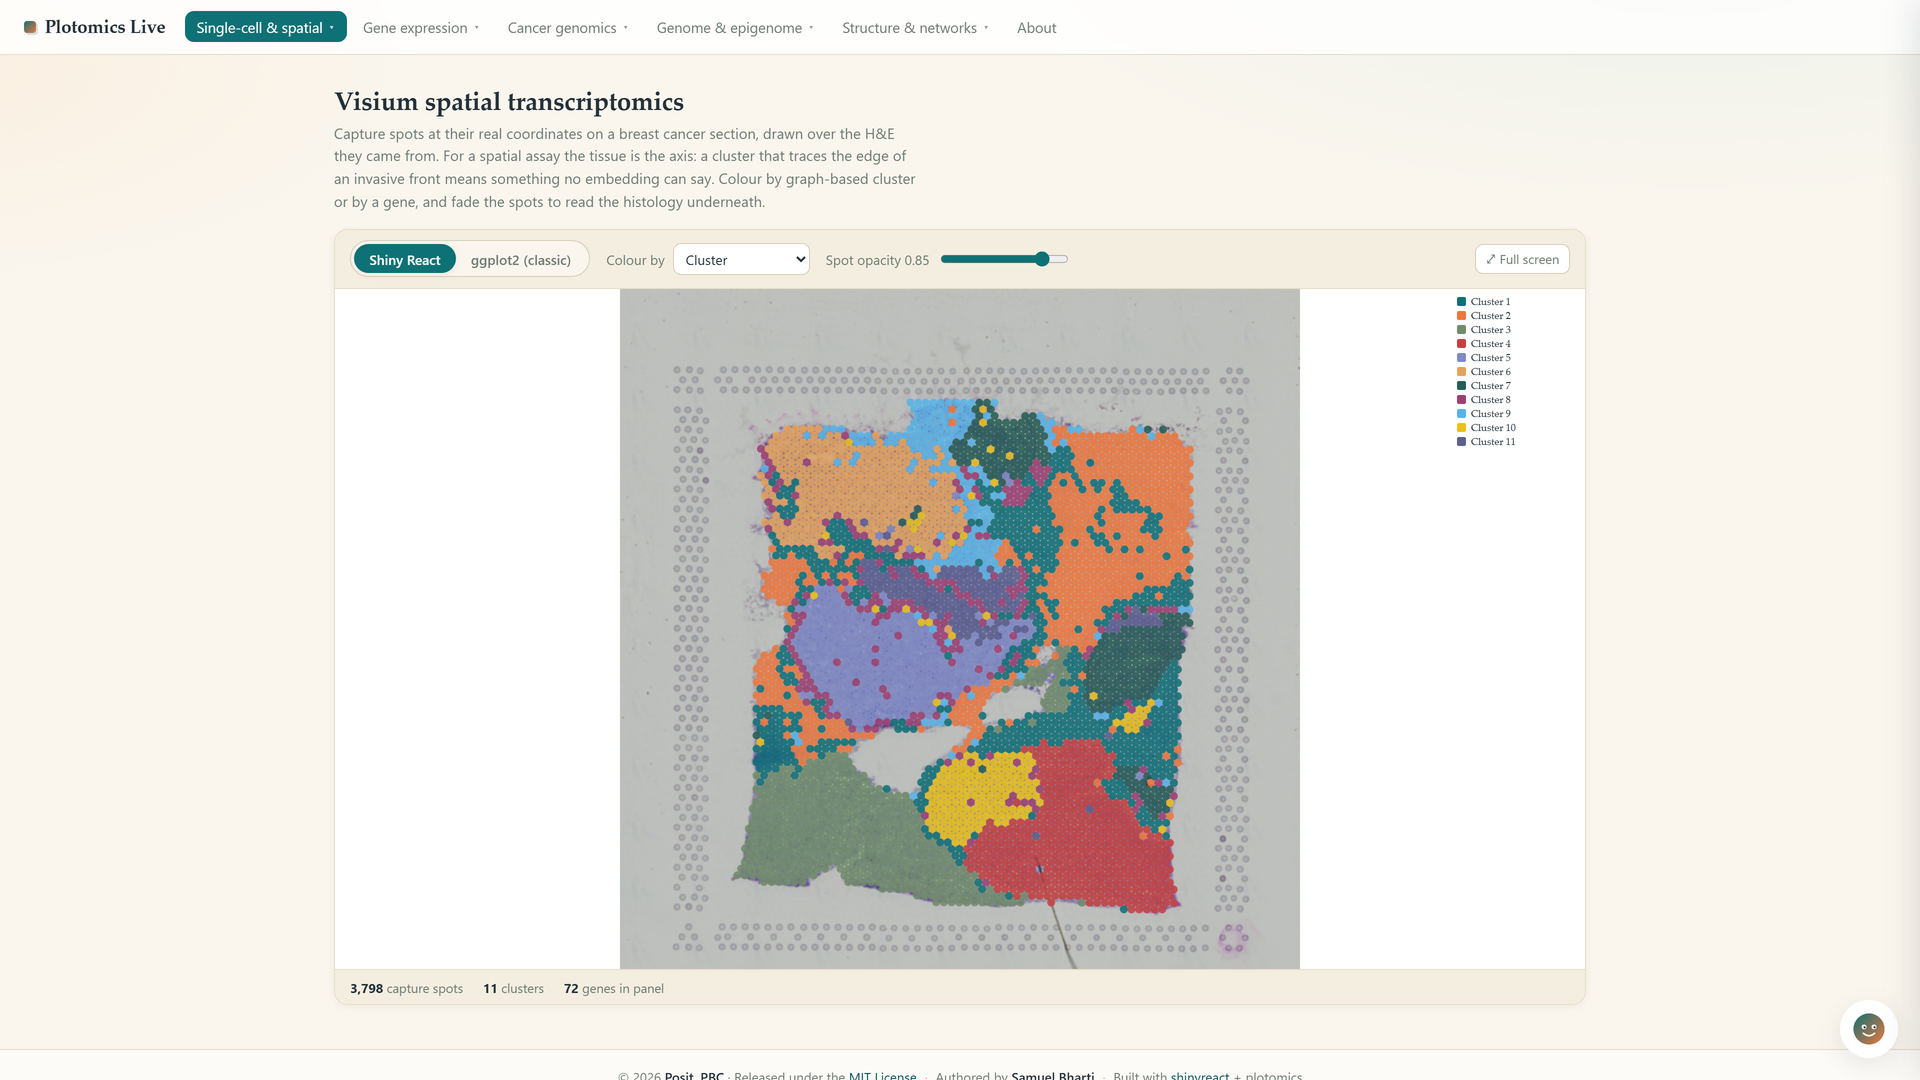
R stays the analytical engine. The browser does the drawing it is good at.
Tahoe-100M
One public dataset. Free to anyone. And effectively nobody can open it.
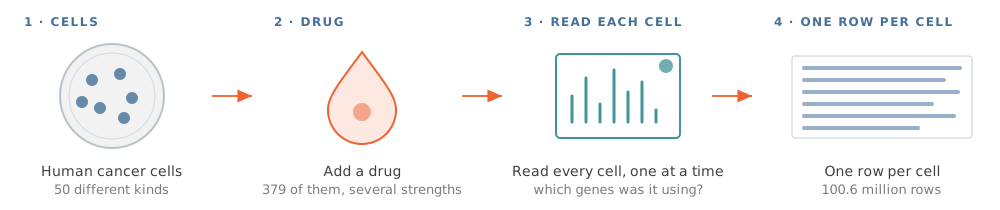
379
drugs
50
human cell lines
100.6M
cells, one row each
![]() GeneScout
GeneScout
 GeneScout
PROMPTS
Two hundred candidate genes,
reduced to 30.
One disease name, one defensible panel
Gene List Builder Breast cancer resolves to MONDO:0007254, and seven sources answer in parallel.
The weights are visible and adjustable. Every gene traces back to its source database.
Five focused applications
Recount Explorer, DE Explorer, Signature Scoring, Drug Perturbation and Genome Explorer. One common workflow each, wrapped so somebody else can run it.
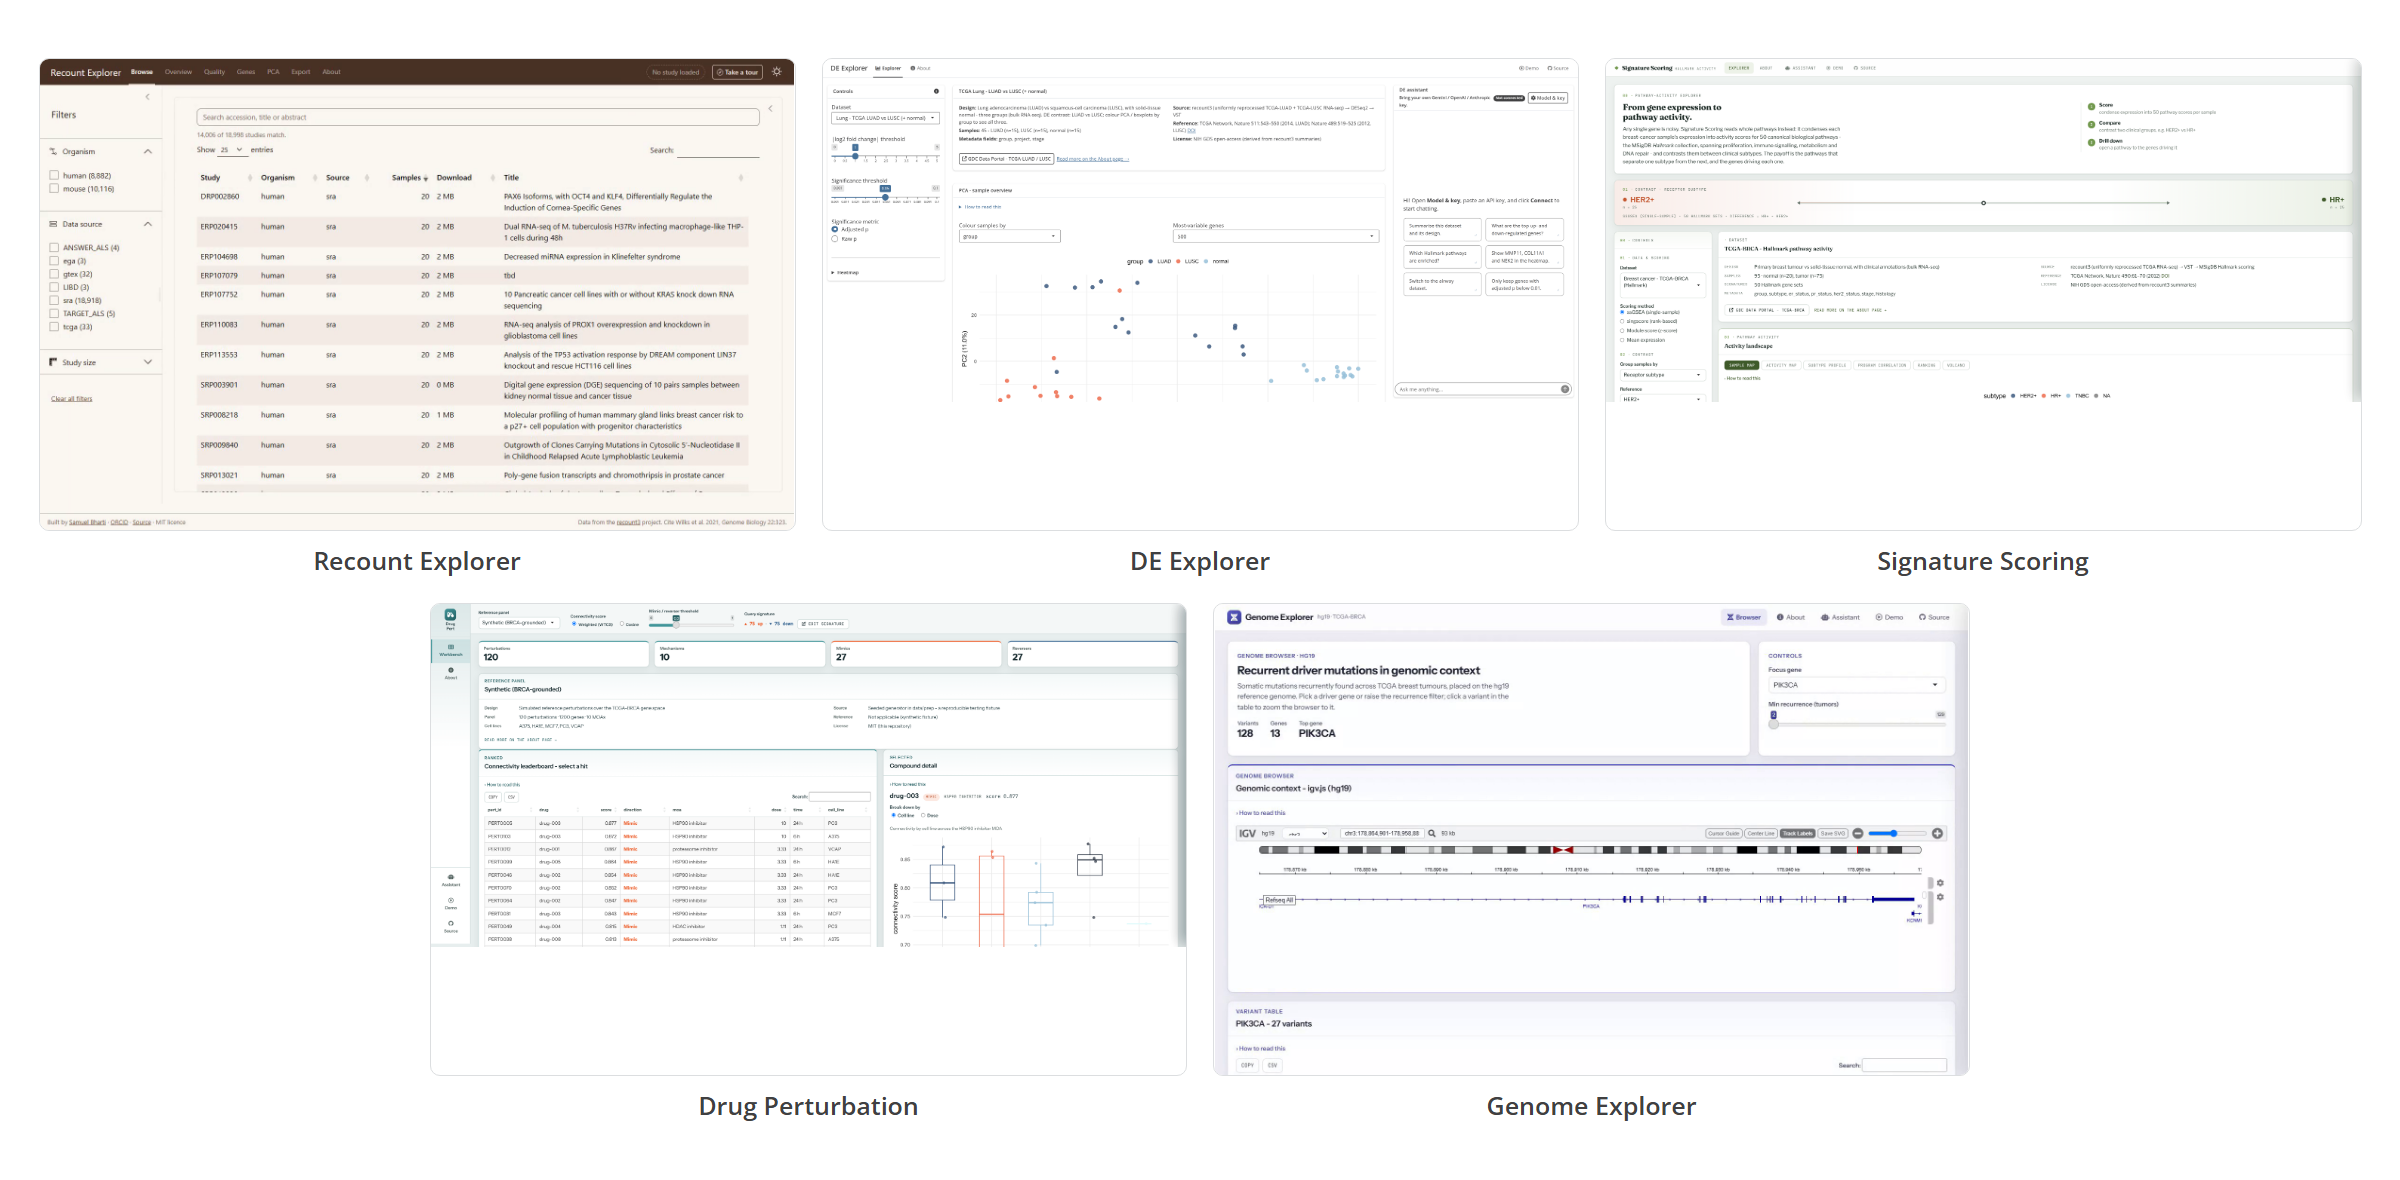
An analysis can end in a tool, not in a script the next person has to rerun.
![]() biobouncer
biobouncer
The other thing every one of those apps calls first.
48
identifier systems
4
validation modes
![]() biohttp
biohttp
Every external service fails in its own way. This is the part nobody should have to write twice.
7
concerns handled once
2
kinds of nothing
The service said no
A clean empty answer. The gene is real, there is simply nothing recorded on it.
The service fell over
A timeout, a 500, a rate limit. Same silence on screen, completely different problem.
Knowing which one you got is the whole reason an app can lean on eighteen services at once.
![]() bioclients
bioclients
biohttp knows how to talk to a service. This one knows what each service is saying back.
29
biological services
2
layers, fetch and parse
Fetching and parsing are separate, so a stored response is enough to test a parser. No live API, no flaky test.
![]() plotomics
plotomics
The rendering core under Plotomics Live, and under anything else that wants these figures.
17
components
1
core, three languages
Fifteen ship in all three languages. The two genome browsers are JavaScript and Python only.
![]() biocohort
biocohort
The least glamorous one, and the one my own research leans on hardest. Before an API or a figure matters, the study has to stay organised.
Subjects and samples
Who, and what came off them.
Assays
RNA, ATAC and whole genome, described in one manifest.
Corrections
A swapped label, fixed once, stays fixed.
Sample sheets
Generated from the manifest, not typed by hand.
These are cheap problems early and very expensive ones later.
Thank you, Shiny team
I came in with biology problems. Almost none of my questions turned out to be biology questions. Thank you to Barret Schloerke and Carson Sievert, and to all of you.